TELUS Health Engage reporting gives admins valuable insight into the needs and behaviors of their employees. With the help of these findings, admins have the opportunity to adapt their workplace wellness measures to the needs of their workforce, plan them based on data, and thus take their health management to the next level.
Navigate to "Resources", then select "Reporting" to view and download your quarterly reports. Reports are generated automatically at the end of each quarter, ensuring that all relevant data is accurately captured and included.
Note: For a report to be generated, a minimum of 15 enrolled app users who actively use the app is required.
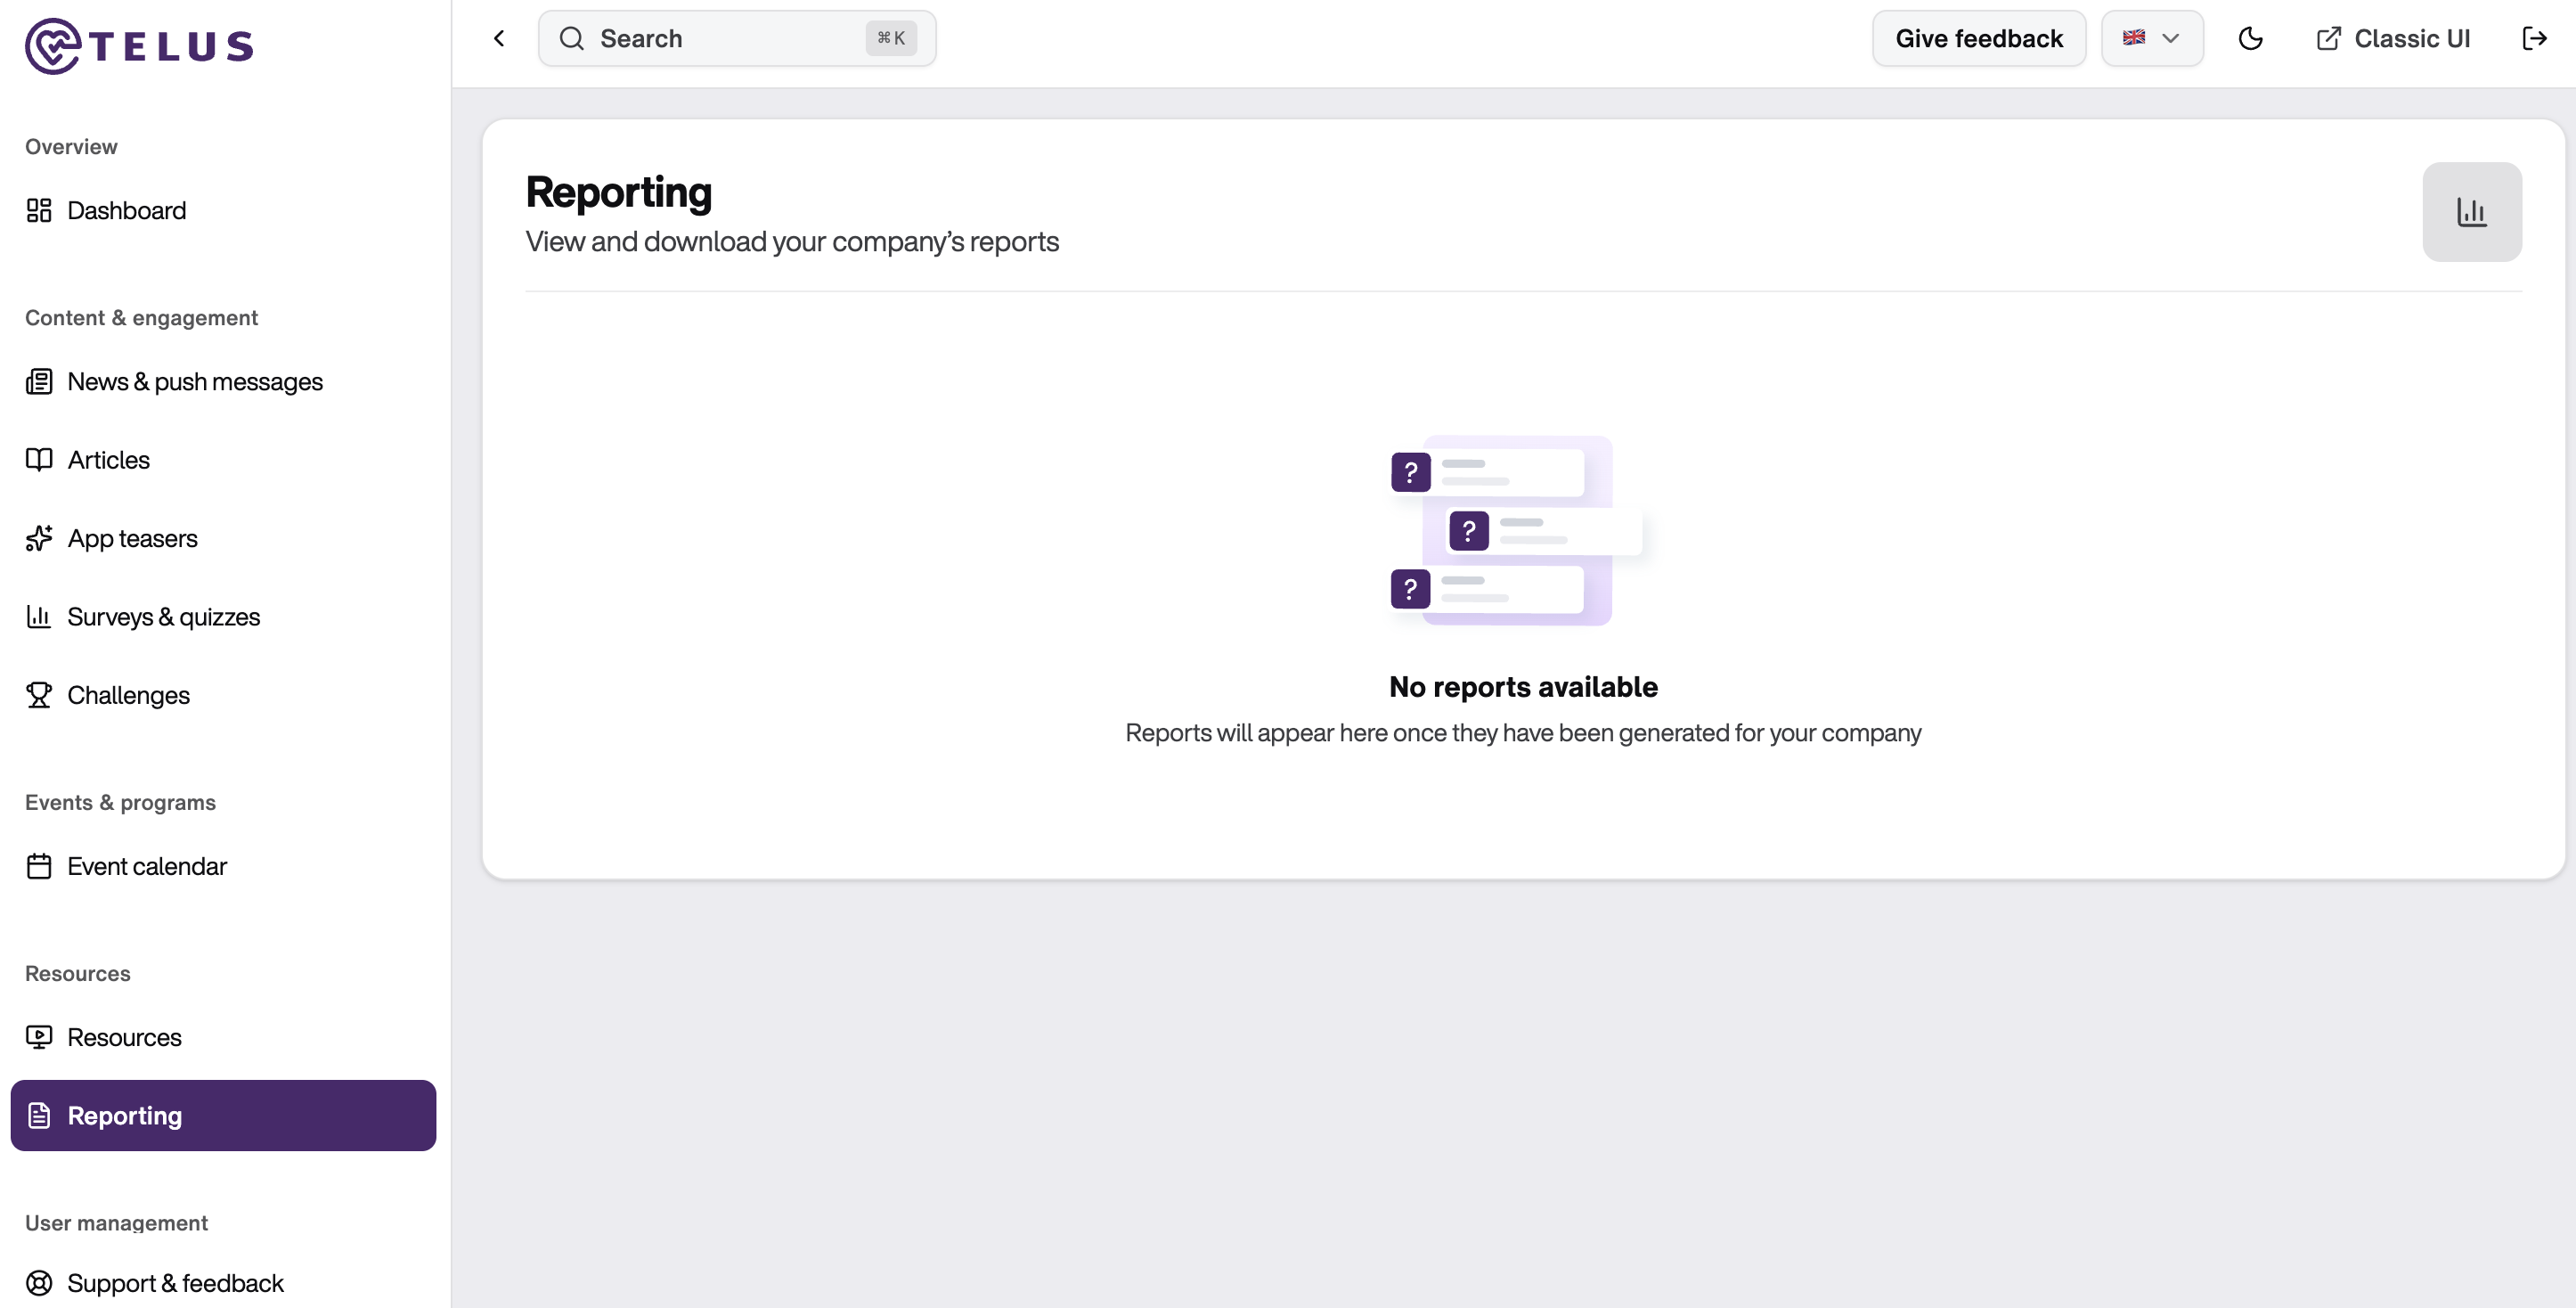
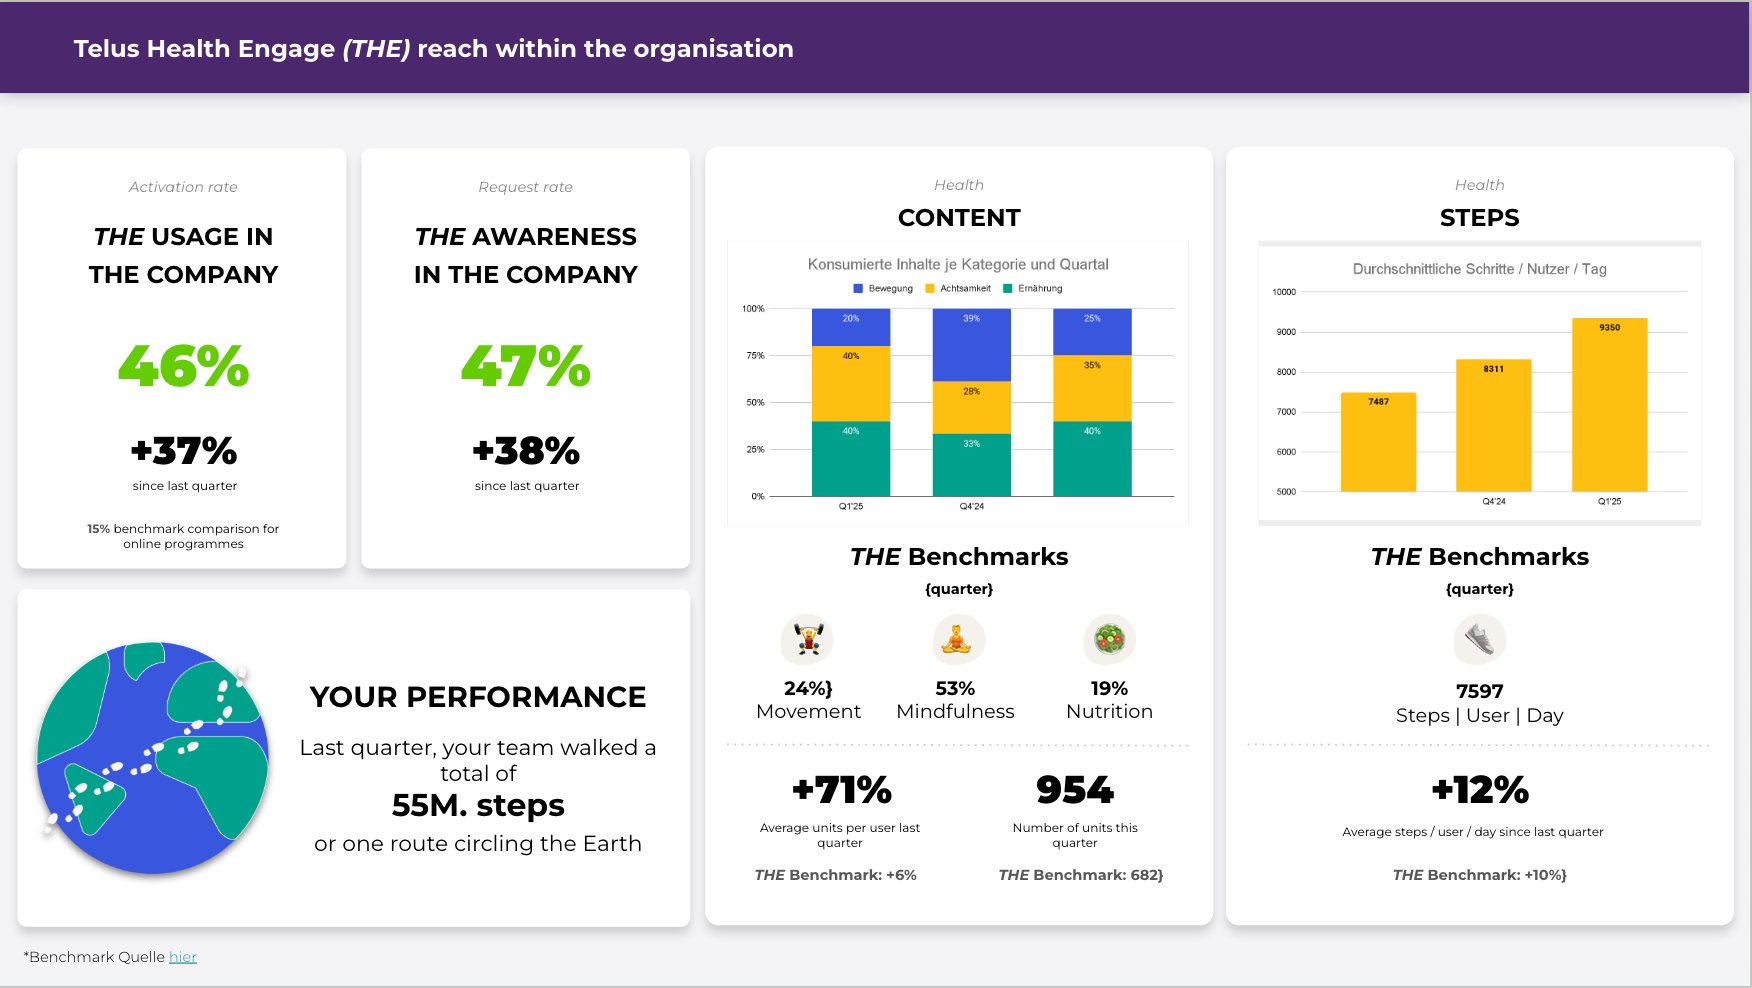
All clients receive a Basic Report every quarter, accessible via the back office. It provides a clear overview of employee engagement and platform usage, helping organizations understand how their workforce interacts with TELUS Health Engage.
The Basic Report includes:
Usage Overview → Provides insights into overall platform engagement, including active users and general usage trends to help identify adoption patterns.
Content Consumption by Topic → Highlights which wellness topics resonate most with your workforce: mindfulness, nutrition, or movement. These insights help you understand employee preferences and allow you to tailor your wellness initiatives accordingly.
Step Activity Tracking → Shows collective employee step activity and compares it against platform benchmarks to provide motivation and track overall activity levels.
Performance Metrics & Benchmarks → Compares organizational performance against TELUS Health Engage averages to identify strengths and areas for improvement.
Note: The list of KPIs in the basic report may be updated from time to time.
Premium customers receive additional reporting each quarter, which is presented during a Quarterly Business Review (QBR) with their Customer Success Manager. Following the meeting, the report is shared for documentation. This enhanced report is not available in the back office.
In addition to the information available in the basic quarterly report, Premium customers receive deeper insights into:
User Engagement → Metrics such as activation rates, request rates, active user trends, and new activations to measure overall program reach and engagement.
Content & Wellness Interests → Analysis of content consumption, popular sessions, completion rates, and emerging wellbeing topics.
Employee Wellness Goals → Insights into health and wellness goals employees are focusing on, as well as the features they use most to support their wellbeing, including content, challenges, progress tracking, and other engagement tools.
Physical Activity & Challenges → Average steps, company-wide step totals, challenge participation, completion rates, and challenge popularity.
Program Utilization → Health points earned, reward redemptions, marketplace activity, premium feature usage, and overall platform engagement.
Insights & Recommendations → Trend analysis, benchmark comparisons, and actionable recommendations to support future wellbeing initiatives.
During the QBR, your Customer Success Manager will resent the report findings, discuss key trends and benchmark comparisons, and provide recommendations to help you maximize the impact of your wellbeing programme.
If you're interested in learning more about Premium reporting or exploring additional service options, please contact us at customer.success@e-therapists.de. Our team will be happy to provide you with detailed information about how we can help you maximize your health management program's impact.
Was this article helpful?
That’s Great!
Thank you for your feedback
Sorry! We couldn't be helpful
Thank you for your feedback
Feedback sent
We appreciate your effort and will try to fix the article